
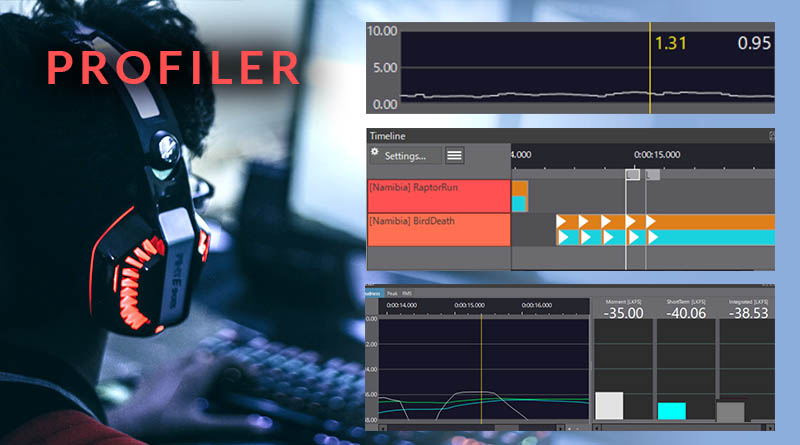
Introducing the Profiler
The Profiler is a powerful tool for debugging playback issues and optimizing performance. It can be accessed from inside Atom Craft, acting as a virtual real-time ecosystem when paired with the Session View. It can also be used together with In-Game Preview to profile a real gameplay scenario.
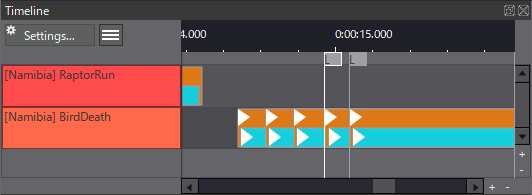
Timeline
The Timeline shows Cue and voice playback for a session. Time is displayed on the horizontal axis, and each Cue is displayed on the vertical axis. Each voice is represented as a blue bar on the Timeline, encapsulated by an orange bar representing a Cue instance.
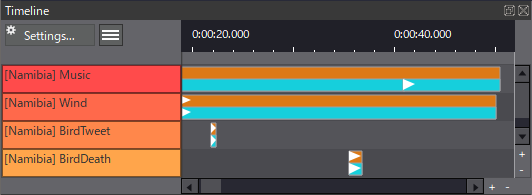
Flags can also be displayed on the Timeline as vertical lines topped with a letter. A red flag with an “E” indicates an error, a gray “L” shows sequence limiting due to exceeding Cue or Category limit, and a gray “V” shows voice limiting due to exceeding Voice Limit Group.
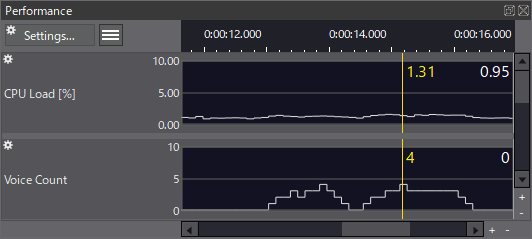
Performance
The performance tab is our primary tool for optimization. Here we can view the CPU load for a given playback session and the number of concurrent voices (and other metrics). Using the Session view, we can simulate a typical gameplay scenario with some music, some ambiance, and a few simultaneously playing sound effects. We can then decide if we need to apply some harsher voice limiting using tools such as Category Limits.
Logs
The TextLog shows all technical details relating to the playback and the audio engine in general. We can see which Cues are being triggered, if any Actions are being performed, parameter value changes, and loads of other important information.
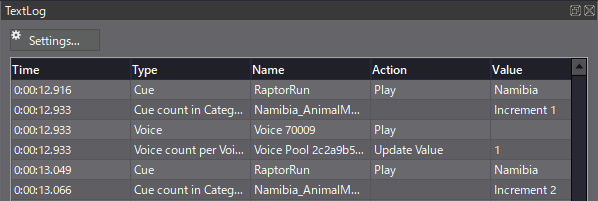
If we open up the settings menu for this tab, we can limit what we see in the text log to avoid filling it up with information we aren’t interested in. Better yet, we can apply custom color-coding to highlight certain things we are interested in. For example, if we need to track a bug relating to a particular Cue, we can highlight it using the “Match to a specified item type” setting.
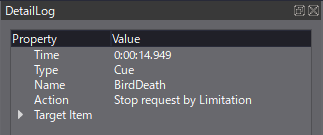
The DetailLog works like a more targeted log, showing richer details relating to an individual component. We can determine things like what type of component it is (e.g., a Cue) and what time it was played/stopped.
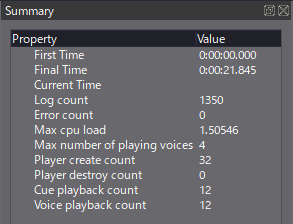
The Summary tab offers general information at the end of playback. We can see the maximum number of voices that played simultaneously, the maximum CPU load, and how many (if any) errors were encountered, etc.
Metering
The metering section helps us to create an appropriately loud mix while avoiding any clipping. We can determine short-term and long-term loudness using the Loudness submenu. The Peak submenu is better suited to keeping an eye on the transient nature of our mix. If the mix components are too transient and harsh, we can find the offending Cues playing during that time in the Timeline.
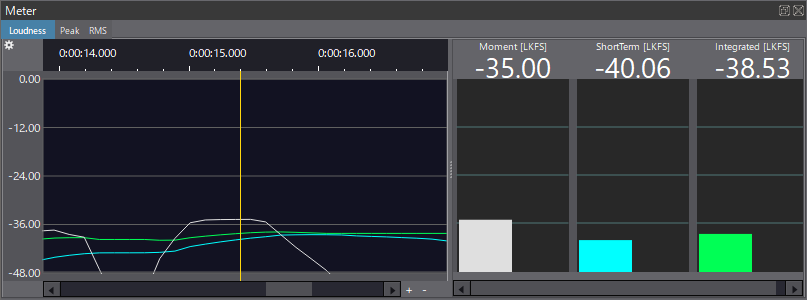
We also have access to a more general MasterBus peak meter as a separate tab when we don’t need complex metering. This is functionally the same as the Level Meter in Atom Craft’s main interface.
General Tips
To get the most out of the Profiler view, here are some tips that apply to several of the tabs:
Many of the tabs have their own settings menu, which can be accessed to the top left of each. For example, these settings offer the ability to view the by Player rather than Cue in the Timeline or access graphs relating to streaming in the Performance tab.
A tab can be undocked by dragging its title bar out, where it can be freely resized. It can then be redocked by double-clicking its title bar or by clicking the double-square icon to the right.
Hold shift + scroll wheel to zoom horizontally or ctrl + scroll wheel to zoom vertically. Using scroll wheel while hovering over a tab will scroll its contents vertically, but we can also scroll horizontally by holding ctrl + scroll wheel while hovering over the relevant horizontal scroll bar.